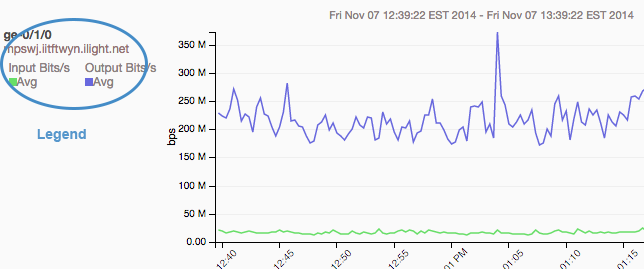
The legend explains the lines on the chart, and shows more information about them.
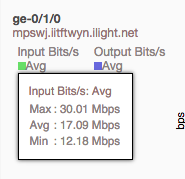
Hovering over a value shows more statistics about it. On this chart, hovering over Input shows the minimum, maximum, and average Input bps.
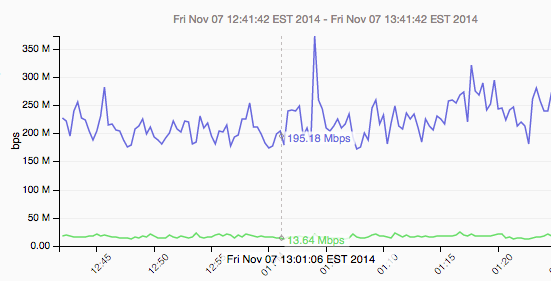
Hovering over lines on the chart will show precise, numerical data for each value at that time.